Contents
Web Dashboard Designer
It is easy to use Ctrl / Shift + Mouse - for work with cells in tables
Flexible change in the way the totals are displayed in the table
The ability to copy table cells in Notepad, Excel, Word
Sampling Optimization in Context
Merging table cells when exporting to Excel
Cloning a version of the «Interactive Dashboard» report
Optimized users search of reports in the administrative module
Renovated «Interactive Dashboard» design
Added search function in the «Interactive Dashboard» filter element
Action «Expand / Collapse» element in the «Interactive Dashboard»
Web Dashboard Designer
The Web Dashboard Designer allows you to create dashboards in a web browser and provides an intuitive UI that facilitates data binding, shaping, layout design, etc. Many of these normally complex tasks can be accomplished with a simple drag-and-drop operation, allowing you to start creating an «Interactive dashboard» immediately.

You can create a new «Interactive Dashboard»:
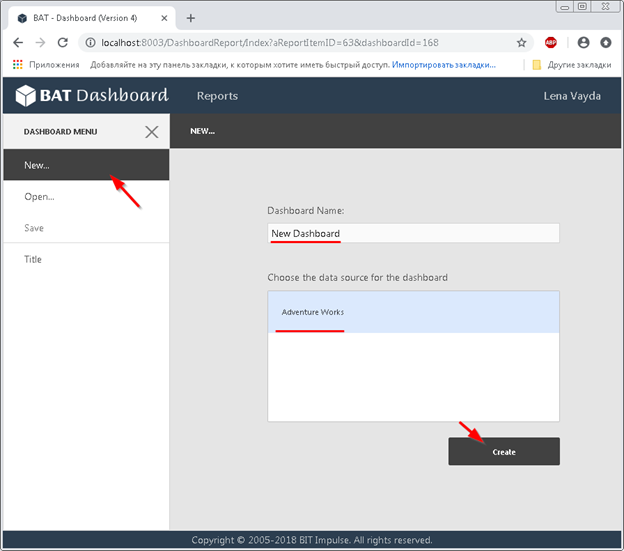
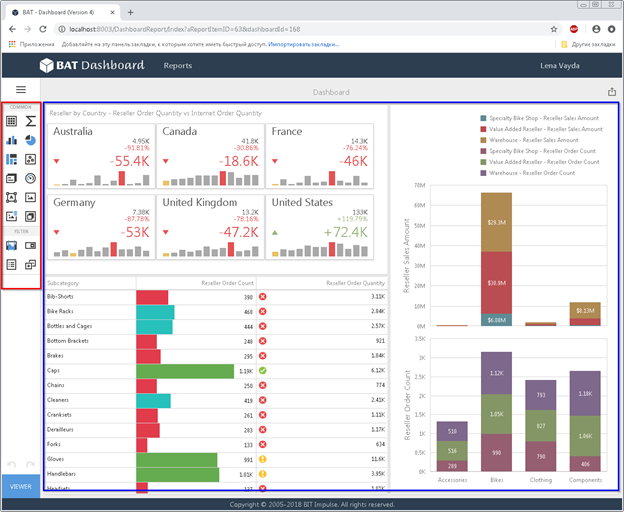
Web Dashboard Designer allows you to create the following dashboard items:
- Pivot
- Grid
- Chart
- Scatter Chart
- Pies
- Gauges
- Cards
- Filter Elements
- Image
- Text Box
Group
You can edit existing dashboard items.
All created or edited «Interactive Dashboard» can be saved right there in the browser.
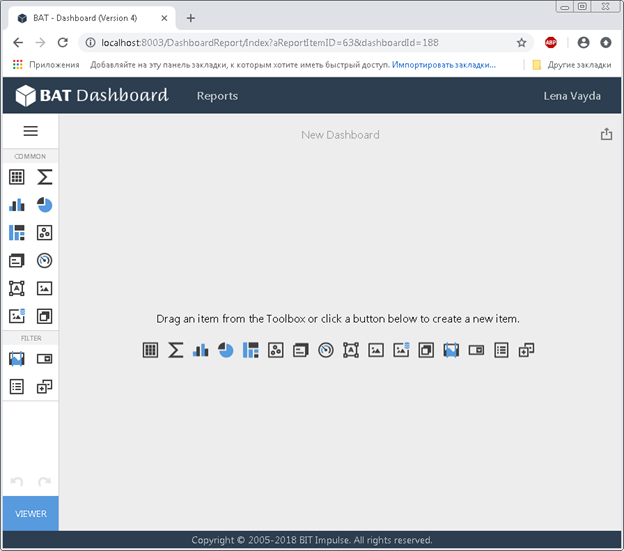
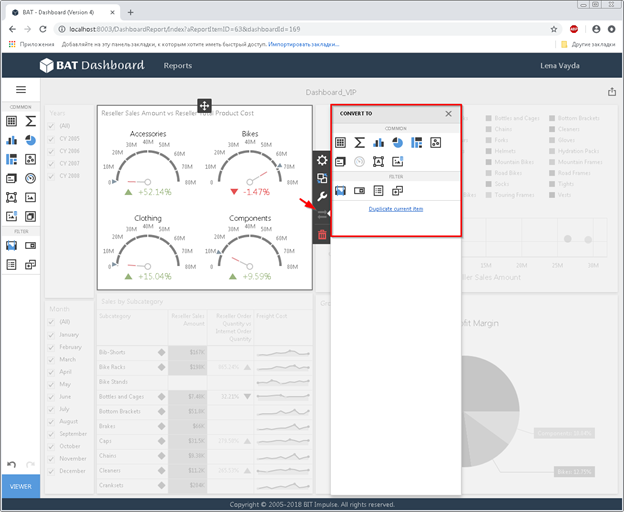
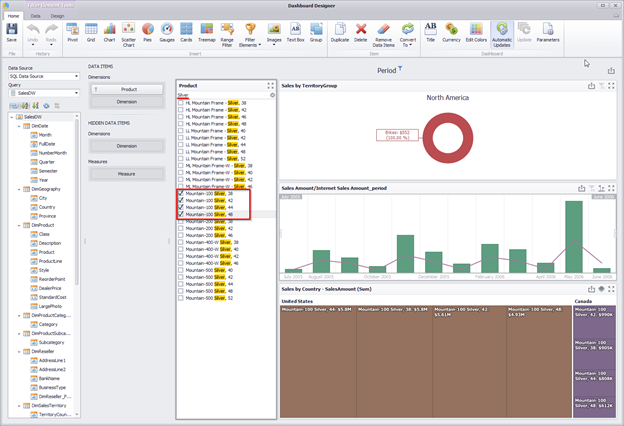
The window of the designer of the «Interactive Dashboard» is as follows:
In the field on the left of the toolbox, buttons are available for creating new items, in the field on the right are the previously created items of the «Interactive Dashboard».
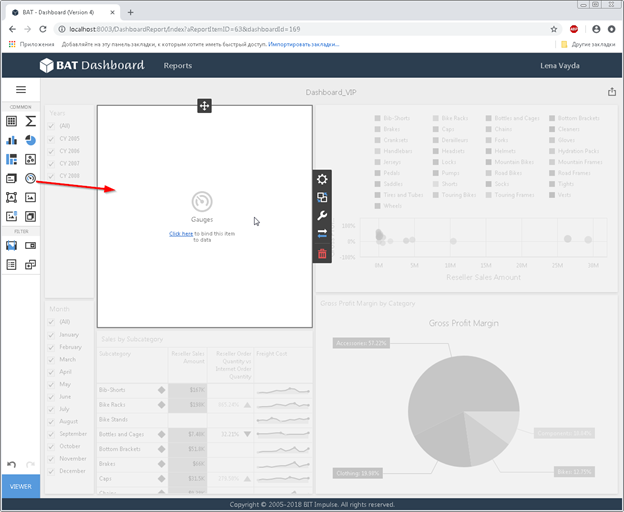
To create a dashboard item, click the corresponding button in the toolbox or drag an item from the toolbox into a dashboard surface:
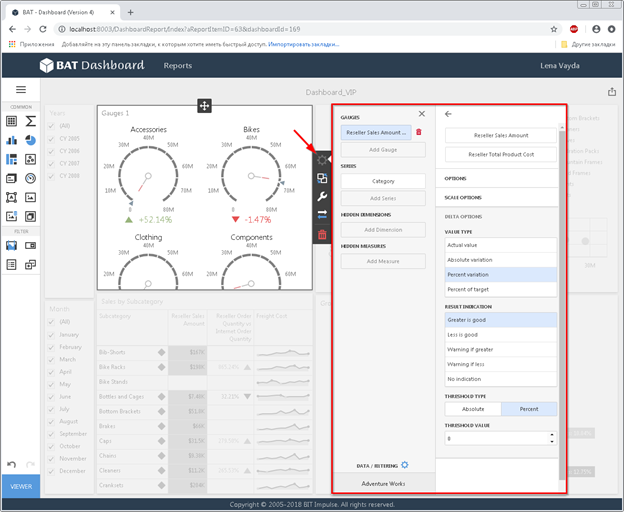
Then you can configure selected item:
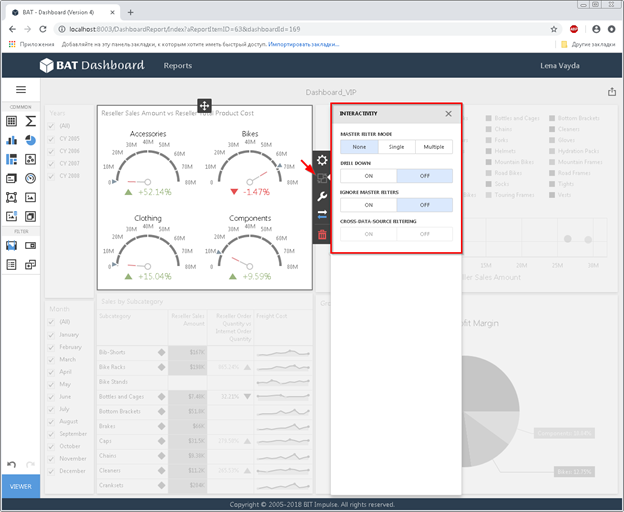
You can specify settings that affect interaction between various dashboard items:
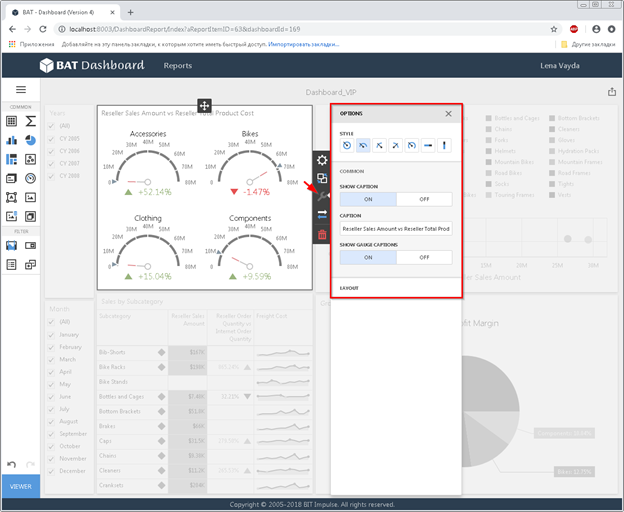
You can specify how an item is displayed:
If necessary, selected item can be copied or converted to any other item:
The following actions are available for dashboard items:
- Drill Down
- Filters
- Sorting
- Formatting
- Highlight
- Spark Line
- Edit Colors
- Parameters
- Print
- Export to PDF, Image, Excel
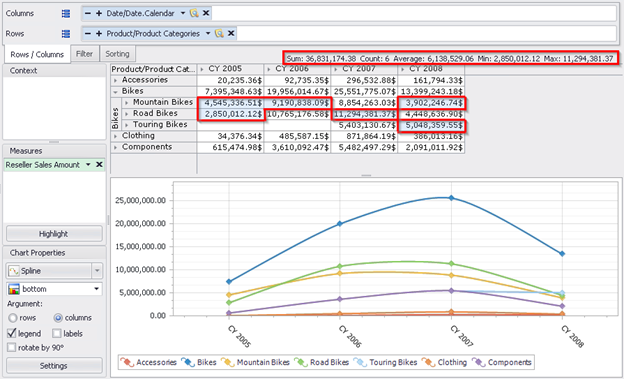
It is easy to use Ctrl / Shift + Mouse - for work with cells in tables
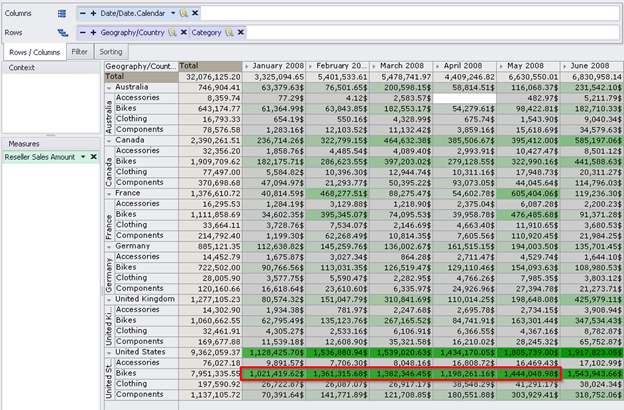
You can select a group of cells using the keyboard shortcuts Ctrl, Shift and mouse and get for this group the values of the sum, quantity, average, minimum and maximum:
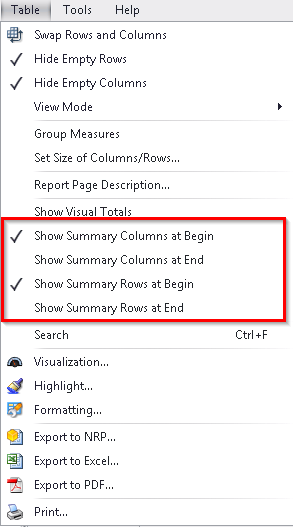
Flexible change in the way the totals are displayed in the table
The totals for rows / columns in the table can now be displayed not only at the end of the table, but also at its beginning:
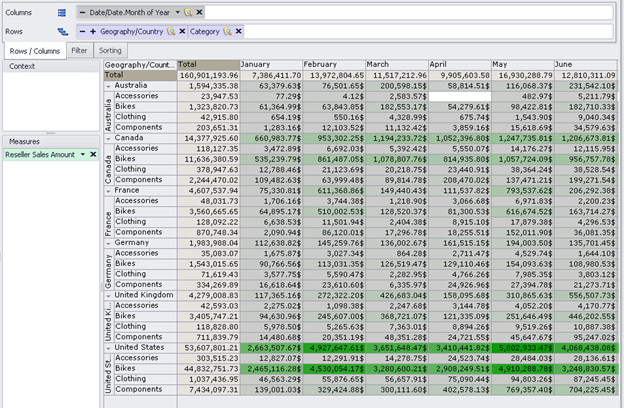
The ability to copy table cells in Notepad, Excel, Word
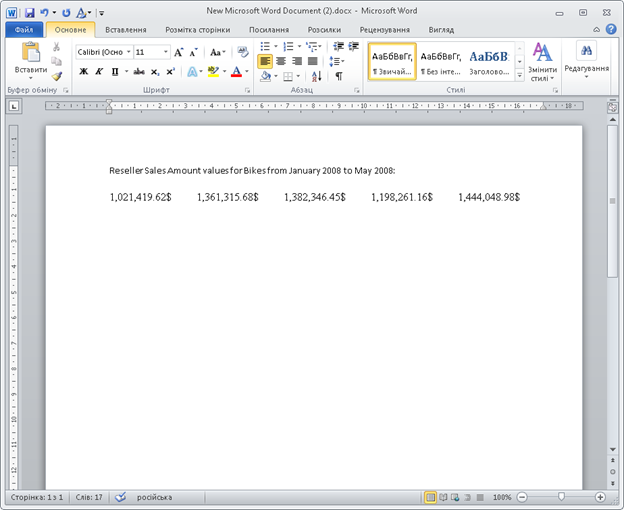
You can use the keyboard shortcuts Shift + mouse, Ctrl + mouse to copy a group of cells from the table and paste into Word, Excel, Notepad:
Sampling Optimization in Context
The work with member selector in the context for a hierarchy with a large number of elements has been optimized.
If the member selector of the hierarchy is no more than 10 thousand elements, then the algorithm of its operation in the context remains the same – all elements of the list will be expanded. If the member selector of the hierarchy is more than 10 thousand elements, the list will not be expanded.
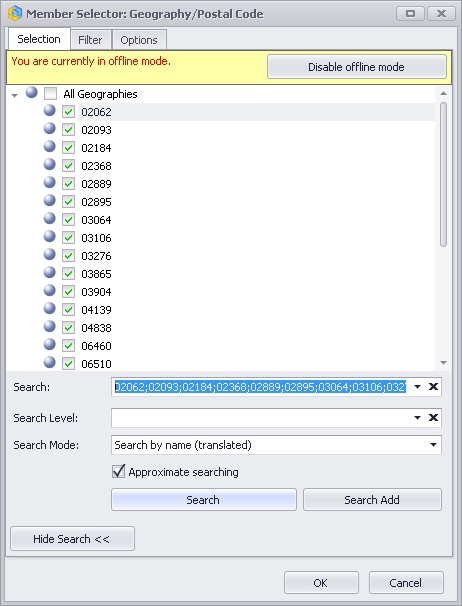
After drag drop the hierarchy into the context, the number of elements exceeds 10 thousand elements, the list of elements will be collapsed, and the search field expanded:

After re-opening the form will contain the latest search settings:
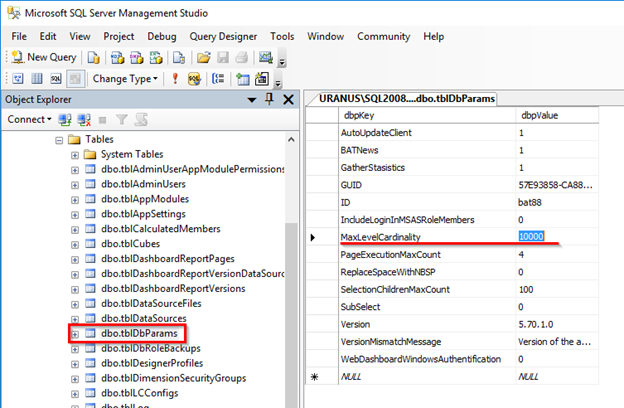
By default, the list of hierarchy elements in the context will be expanded if the member selector of the hierarchy is 10 thousand elements.
The administrator can set this number:
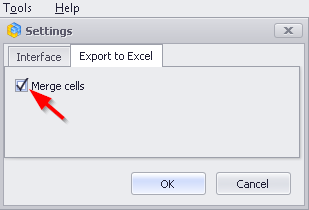
Merging table cells when exporting to Excel
In previous versions, such a function was available from the Tool / Options menu item:
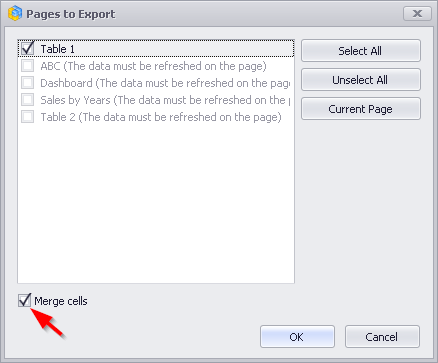
Now the user can select this option when exporting the report to Excel:
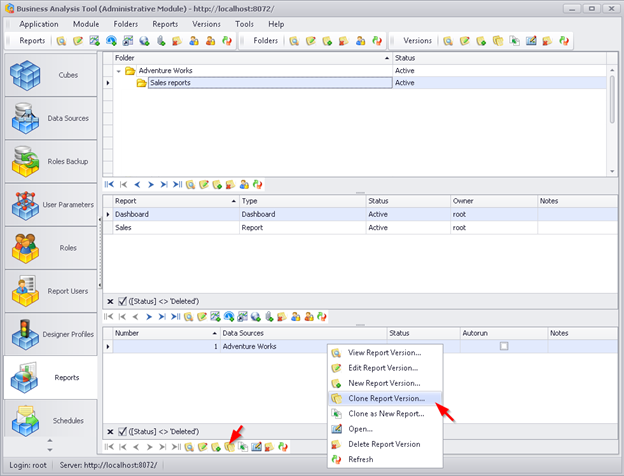
Cloning a version of the «Interactive Dashboard» report
Versions of the «Interactive Dashboard» report can be cloned in the administrative module:
Optimized users search of reports in the administrative module
In the administrative module, on the «Opened Reports» tab, the search for users in the list of user reports is optimized:

Renovated «Interactive Dashboard» design
Added search function in the «Interactive Dashboard» filter element
In the new version for «Interactive Dashboard» in the Filter item, you can use a quick search in the list of hierarchy elements.
This option is on the Design tab of the Filter item:

After you activate this option, you need to uncheck «All»:
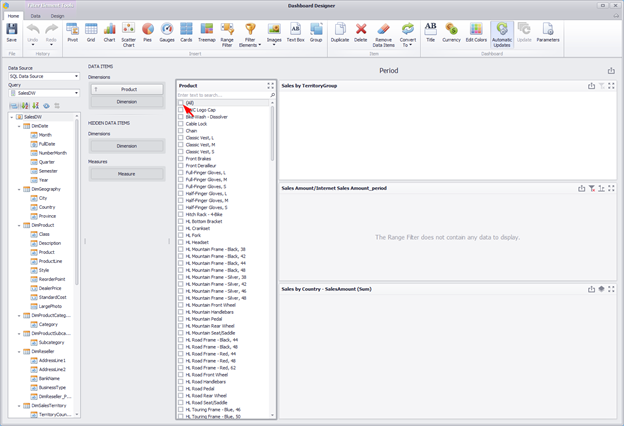
Then enter the keyword in the search field and select necessary elements in the hierarchy:
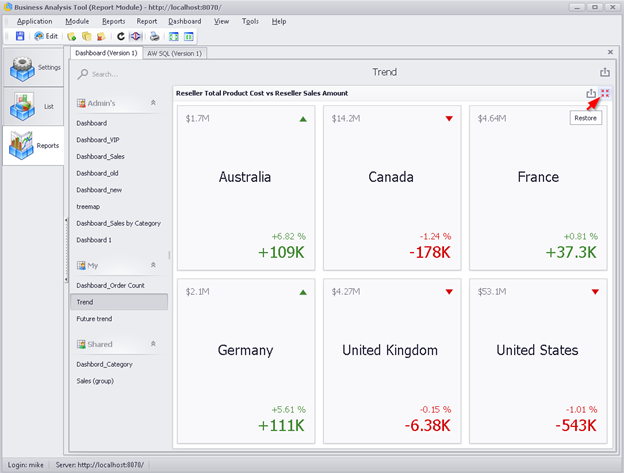
Action «Expand/Collapse» element in the «Interactive Dashboard»
Now you can expand the elements of the «Interactive Dashboard»:
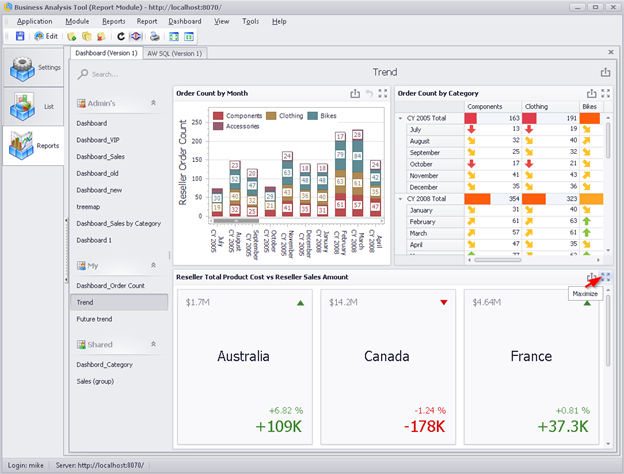
This allows you to consider in more detail those elements of the «Interactive Dashboard» that contain a large amount of data: